Introduction
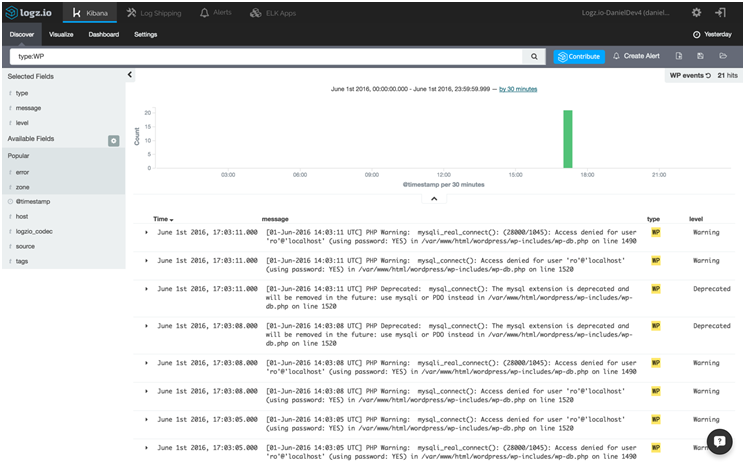
When you develop the website, it is not a bad idea to control the possible errors or check other information the server replies to your queries. One of the best ways to do that is to set up and read the WordPress logs. In the article, we are going to explain what are the types of log files, and how to set them up on different servers and read them to analyze the different aspects of your website.
How to set up WordPress Error Logs?
There are two main server types: Apache and Nginx. Let’s see how to set up a WordPress error log for each of them.
Apache is a powerful open-source solution for web servers. The logging capabilities in Apache are very flexible. Most log setting options are applicable to any operating system, but some of them are specific only to Unix or Linux.
Apache by default is pretty well configured for logging one’s site. The standard httpd.conf file must have a section of logs with detailed comments for each directive. The default log directory is usually located in /etc/httpd/logs. Now let’s look at the log settings section:
ErrorLog logs/error_log
LogLevel warn
LogFormat "%h %l %u %t \"%r\" %>s %b \"%{Referer}i\" \"%{User-Agent}i\"" combined
LogFormat "%h %l %u %t \"%r\" %>s %b" common
LogFormat "%{Referer}i -> %U" referer
LogFormat "%{User-agent}i" agent
CustomLog logs/access_log combined
Apache WordPress Error Log
The WordPress error log contains messages from Apache like errors, notifications, warnings, etc. This log is very useful for finding and fixing server-side problems. It is written in the site’s Apache config file usually placed in /etc/apache/sites-available/ folder. Let’s see how to set up it:
If you want to store all information about errors in one log, this directive will suffice. However, you can specify a WordPress error log file for each domain. This is done in the <VirtualHost> sections approximately as follows:
<VirtualHost 10.0.0.2>
DocumentRoot "/home/sites/domain1/html/"
ServerName domain1.com
ErrorLog /home/sites/domain1/logs/error.log
</VirtualHost>
If you are a system administrator or have root access to the server, you should be able to monitor these logs. We recommend using one file. And if you provide hosting for clients, it is more convenient to set a separate error log for each client so that they can track their errors.
The level of errors entering the log is set as follows:
Types of Errors
The following error levels are defined in Apache:
- emerg — emergency – the system does not function;
- alert — the error must be immediately corrected;
- crit is a critical error;
- error;
- warn — warning;
- notice — notification (normal operation);
- info — information message;
- debug — debug message.
Keep in mind that all subsequent levels include previous ones. That is if we set the warning level, the log will get errors from the following classes: emerg, alert, crit, error, and warn.
WordPress Error Log Nginx
Log files are the first place to look for errors. Especially if it relates to a web server. In Nginx, there are only two main logs: error log and access log.
Logging of the Nginx errors occurs in a specific file, stderr, or Syslog. It collects all the errors that occurred during the operation of the webserver. By default, it is enabled globally:
To log only certain errors, you need to place a directive in the HTTP, server, stream, or location section. And so you can only log critical errors and alarms
Nginx: Types of logs
An error log is very useful when debugging site issues, configuring new plugins, and installing themes. So, for example, if you see a “White Screen of Death” Error when you open your site, the first thing to do is to open an error log for this site in your account. The error log is the most optimal way to monitor and detect errors when working or configuring a site.
The Access log shows the IP addresses and which URL has been accessed, along with a timestamp for each domain. This can be useful for the detection and analysis of third-party log analyzers and for identifying security issues like DDOS attacks.
Next, remember that the logs are included in the total quota of disk space for the account. If you have little space on your server, then you need to periodically clean these logs or turn them off.
With the correct operation of the site (without errors) and a small number of visitors, your logs will be small. That’s why you can clean them periodically if there is not enough disk space.
But there are cases when the error log or the access log becomes very large. The error log can be large in size if some script does not work correctly and every time it is accessed, an error occurs that is noted in the log — such a log will have many entries and, accordingly, a large size.
The access log can be of a large size if a site is under attack like a DDoS attack.
How to enable WordPress Error logs (Nginx)
In order to enable a dedicated and separate Error and Access log for a single site, we need to add the following code in its Nginx site config file. This file is usually present in the ‘/etc/nginx/sites-available/‘ folder.
access_log /srv/www/test.com/logs/access.log;
error_log /srv/www/test.com/logs/error.log;
How to enable logs using wp-config.php
The wp-config file contains basic parameters and settings for your site on WordPress. It stores such important data as connection settings to the database, a prefix for the database tables, and an address for logging into the admin area if WordPress is installed in a subdirectory.
But in addition to the basic settings, wp-config can also be used to set other parameters. For example, you can enable debugging mode (wp_debug) and write all the received data to the error log. In most cases, this helps to identify and fix problems on the site.
First of all, you need access to the wp-config.php file itself. The file is located in the root directory of WordPress, and in order to edit it, we need an FTP client or File Manager if you have access to cPanel.
Open the file wp-config.php and find there the line “That’s all, stop editing! Happy blogging.”
Just before this line, add a new line of code:
define ('WP_DEBUG', true);
Perhaps this line is already present in the file with the “FALSE” value. In that case, you do not need to duplicate it, just change FALSE to TRUE.
With this code, you will enable WordPress to debug mode. Be ready that WordPress will display all warnings and errors on the site at the top of the page, both in the admin panel and on the site itself.
Therefore, the general recommendation is not to leave debug mode on permanently, use it only when necessary.
Now, in order to additionally include the record of all detected errors and warnings in the log file, add one more line of code in the same wp-config file, just below the line with WP_DEBUG:
define ('WP_DEBUG_LOG', true);
How to view WordPress Error logs
From command line
To view the logs from the SSH console or command line, we will use the ‘tail‘ command in this example.
The tail command allows you to view the last 10 lines of the file, in this case, the error or access log.
tail /srv/www/test.com/logs/error.log
In case you need to see more number of lines, For example, 25, then we can use the ‘n’ flag :
tail -n 25 /srv/www/test.com/logs/error.log
Or the following way:
tail -25 /srv/www/test.com/logs/error.log
The second useful parameter that you can pass is -f. With this parameter, the tail displays the specified number of last lines and continues to read the lines to add, until you press Ctrl+C.
It means that you can live-track the changes in the log file. This is particularly helpful when trying to pinpoint the exact URL which is causing the error. You can reload the page and see exactly which errors it is throwing :
tail -5f /srv/www/test.com/logs/error.log
Here is a sample output for a tail command:
2018/07/07 10:34:21 [error] 11738#11738: *128307 FastCGI sent in stderr: "PHP message: PHP Warning: json_decode() expects parameter 1 to be string, array given in /srv/www/test.com/public_html/wp-content/plugins/wpbase-cache/wpbase-cache.php on line 74" while reading upstream, client: 124.40.251.253, server: test.com, request: "POST /wp-admin/plugins.php?plugin_status=all&paged=1&s HTTP/1.1", upstream: "fastcgi://127.0.0.1:9000", host: "test.com", referrer: "https://test.com/wp-admin/plugins.php?plugin_status=all&paged=1&s"

2018/07/10 02:12:44 [error] 29169#29169: *16240 FastCGI sent in stderr: "PHP message: PHP Fatal error: Out of memory (allocated 14680064) (tried to allocate 4096 bytes) in /srv/www/test.com/public_html/wp-content/plugins/jetpack/class.jetpack.php on line 2097" while reading response header from upstream, client: 185.85.191.201, server: test.com, request: "GET /wp-login.php HTTP/1.1", upstream: "fastcgi://127.0.0.1:9000", host: "test.com"

2018/07/10 07:01:31 [error] 32488#32488: *2605 recv() failed (104: Connection reset by peer) while reading response header from upstream, client: 66.249.79.10, server: test.com, request: "GET /mlebusik/?action=lostpassword HTTP/1.1", upstream: "fastcgi://127.0.0.1:9000", host: "test.com"

2018/07/11 03:59:43 [error] 10455#10455: *27706 FastCGI sent in stderr: "PHP message: PHP Fatal error: Out of memory (allocated 2097152) (tried to allocate 16384 bytes) in /srv/www/test.com/public_html/wp-includes/general-template.php on line 1507" while reading response header from upstream, client: 66.249.79.31, server: test.com, request: "GET /robots.txt HTTP/1.1", upstream: "fastcgi://127.0.0.1:9000", host: "test.com"
Let’s breakdown one error log entry and see what it means:
2018/07/11 03:59:43 [error] 10455#10455: *27706 FastCGI sent in stderr: "PHP message: PHP Fatal error: Out of memory (allocated 2097152) (tried to allocate 16384 bytes) in
/srv/www/test.com/public_html/wp-includes/general-template.php on line 1507" while reading response header from upstream, client: 66.249.79.31, server: test.com, request:
"GET /robots.txt HTTP/1.1", upstream: "fastcgi://127.0.0.1:9000", host: "test.com"
- 2018/07/11 03:59:43— Timestamp, when the error occurred
- [error] —Type – Error. This can also be a Notice, Warning, etc;
- “PHP Fatal error: Out of memory ….” — Error message;
- “66.249.79.31” — IP from where the request originated;
- [07/Aug/2013:23:04:22 +0000] — request date and time;
- GET /robots.txt HTTP/1.1 — the request;
- host: “test.com” — The Domain name;
Apache Error Log Example :
site.com [Sat May 31 12:07:10 2008] [error] [client 127.0.0.1] File does not exist: /srv/www/test.com/public_html/favicon.ico
site.com [Fri Aug 05 13:50:37 2011] [alert] [client 127.0.0.1] /srv/www/test.com/public_html/.htaccess: RewriteRule: cannot compile regular expression '^edit_serv/(.*):([0-9]{2,20}+)/
The logs include the domain name to which the request was registered, the time of the request, the IP address from which the access was made, and, directly, the error text.
View WordPress Error log using FTP
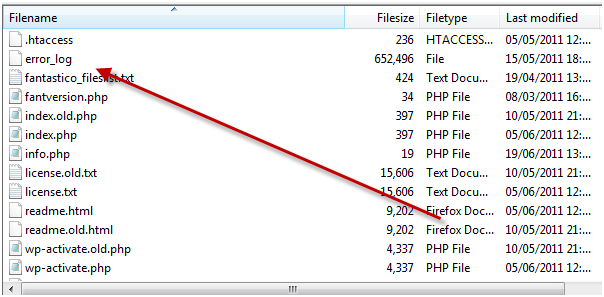
If you have an FTP user credential that has sufficient permissions to access the WordPress Error log and access log files, then you can simply log in using an FTP Client like FileZilla and then navigate to the Error log Directory and download it or open it directly in an editor of your choice.
The WordPress error log is a great way to control the website processes. How often do you use them?
The logs include the domain name to which the request was registered, the time of the request, the IP address from which the access was made, and, directly, the error text.
Summary
The WordPress error log is a great way to control the website processes. It contains all the warnings and error messages your website has gone through. So you need to know how you can set up and access them from time to time.
However, if you have already set up WordPress error logs on your website, then How often do you use them? Do let us know in the comment section below!
Save your time, money, and resources, and give your website a mammoth growth with WPOven’s Agency wordpress hosting.
- 24X7 WordPress Expert support
- Cloudflare integration
- High-end Security
- Datacentres around the world, etc.
You can have all these features and much more in a single plan with unlimited Free migrations, unlimited staging, and a 14-day risk-free guarantee. Check out our plans or Contact our support team that assist you in choosing the right plan.
Frequently Asked Questions
How do I find my WordPress error log?
You can find WordPress error logs in the site’s Apache config file usually placed in /etc/apache/sites-available/ folder or you can go to File Manager and look out for the wp-content folder and locate the debug.log file.
What is WordPress error log?
Error logs are generally a collection of all the tracks and records that contains possible error reports and information the server replies to your queries.
How do I create a WordPress error log?
1. First you need to access the wp-config.php file itself. The file is located in the root directory of WordPress.
2. And in order to edit it, we need an FTP client or File Manager if you have access to cPanel.
3. Open the file wp-config.php and find there the line “That’s all, stop editing! Happy blogging.”
4. Just before this line, add a new line of code:
define (‘WP_DEBUG’, true);
5. Perhaps this line is already present in the file with the “FALSE” value. In that case, you do not need to duplicate it, just change FALSE to TRUE.
6. Now WordPress will display all warnings and errors on the site at the top of the page, both in the admin panel and on the site itself

I am a Co-Founder at WPOven INC currently living in Vancouver, Canada. My interests range from Web Development to Product development and Client projects. I am also interested in web development, WordPress, and entrepreneurship.


