Everyone knows Kevin Ohashi as the geek behind the review signal, The Review Signal Is a web hosting review blog that compares all the hosting providers on the basis of their performance benchmarks. WOven is glad to announce that we have been featured by Review Signal as a top VPS WordPress Hosting Service for 2020.
WPOven for the last three years continuously coming out as a top Managed WordPress Hosting in all the Benchmarks and is at par with companies like A2 Hosting, Cloudways, FlyWheel, Kinsta, etc.
Read Our Comparisons Here to check out How WPOven Is a Clear Best Alternative to these popular Hostings –
Check out WPOven’s Review By Review Signal Here
In the review, Kevin has tested the following companies –
Compare the plans of these hosting’s here
- 1 IONOS
- 34SP.com
- A2 Hosting
- WPOven.com
- ChemiCloud
- Cloudways
- DreamHost
- Flywheel
- GoDaddy
- GreenGeeks
- GridPane
- high availability (formerly Incendia WebWorks)
- InMotion Hosting
- Jelastic *
- Krystal Hosting
- LightningBase
- NameCheap
- Nestify
- Onyx
- Pantheon
- Pressable
- Presslabs
- Raidboxes
- Seravo
- Servebolt
- SiteGround
- TVC.Net
- Wetopi
- WordPress.com Business
- WordPress.com VIP
- WPCycle
- WPX Hosting
There were 6 different price points namely –
- Under $25
- $ 25 – 50
- $ 52 – 100
- $101 – 200
- $201 – 500
- Enterprise $ 500 +
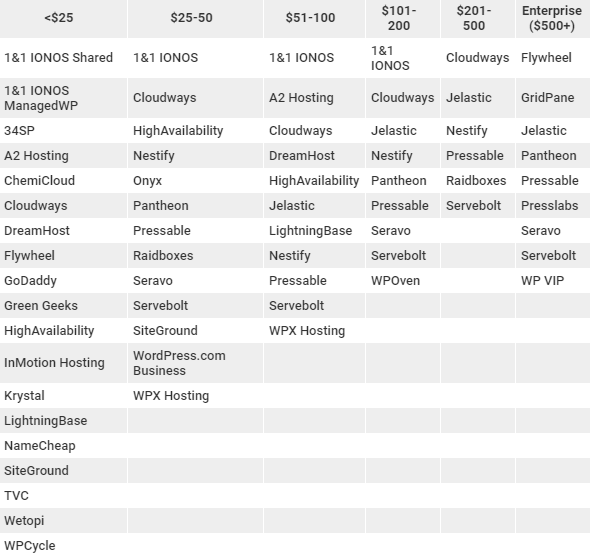
WPOven participated in the fourth category of $ 101 – 200 along with 1 IONOS, Cloudways, Jelastic, Nestify, Pantheon, Pressable, Seravo, Servebolt here is the image for better understanding –
All the testing took place with WordPress 5 with a dummy site. Check out the dummy site here http://wordpresshostingbenchmarks.reviewsignal.com/
In The process, LoadStorm scaled test users on the basis of pricing plans. The users hit the homepage, login page, blog posts, etc. The complete duration was attributed to being 30 mins. The users were scaled from 500 to 400 over a time frame of 20 minutes and the peak load was maintained for 10 mins.
The test was run through 12 different server locations to simulate real users.
Results Table
| Company Name | Total Requests | Total Errors | Peak RPS | Average RPS | Peak Response Time(ms) | Average Response Time (ms) | Total Data Transferred (GB) | Peak Throughput (MB/s) |
Average Throughput (MB/s)
|
| 1&1 IONOS | 524,757 | 41,655 (7.94%) | 380 | 292 | 15,593 | 505.00 | 23.53 | 17 | 13 |
| Cloudways | 405,655 | 0 (0%) | 282 | 225.36 | 13,206.00 | 2,012.00 | 21 | 14 | 12 |
| Jelastic, Inc | 900,234 | 1,030 (0.11%) | 693 | 500 | 14,609 | 219.00 | 48.21 | 37 | 27 |
| Nestify | 692,645 | 1(0%) | 540 | 385 | 15,054 | 523.00 | 42.65 | 34 | 24 |
| Pantheon | 794,976 | 132 (0.02%) | 621 | 442 | 15,102.00 | 116.00 | 45 | 36 | 25 |
| Pressable | 809,307 | 0(0%) | 587 | 450 | 12,354 | 970.00 | 41.58 | 30 | 23 |
| Seravo | 765,043 | 121,572 (15.89%) | 531 | 425 | 5,029 | 641.00 | 34.33 | 23 | 19 |
| Servebolt.com | 926,739 | 1,038 (0.11%) | 879 | 515 | 15,100 | 108.00 | 33.93 | 33 | 19 |
| WPOven | 728,369 | 94 (0.01%) | 577 | 405 | 15,100.00 | 424.00 | 42 | 34 | 24 |
Full interactive results can be referenced here.
Discussion
Jelastic, Nestify, Pantheon [Reviews], Servebolt and WPOven all handled the Load Storm test without issue.
You can check out WPOven’s Load Storm Performace here
Load Impact Testing Results
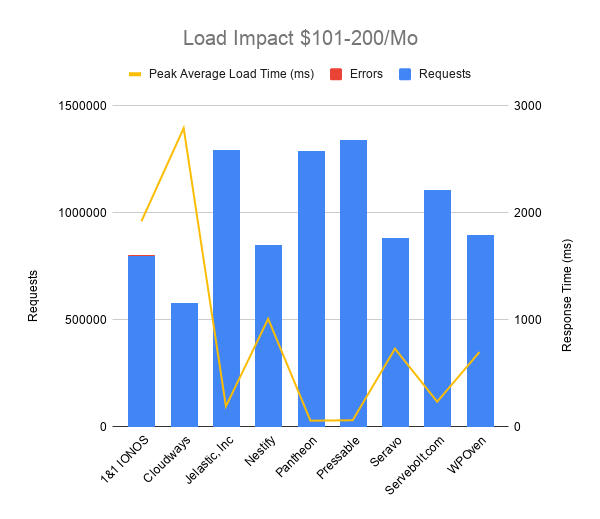
Load Impact is designed to test cached performance by repeatedly requesting the homepage.
Results Table
| Company Name | Requests | Errors | Data Transferred (GB) | Peak Average Load Time (ms) | Peak Average Bandwidth (Mbps) | Peak Average Requests/Sec |
| 1&1 IONOS | 796414 | 5000+ | 3.45 | 1920 | 35.62 | 1640 |
| Cloudways | 578617 | 0 | 32.62 | 2790 | 378.37 | 820 |
| Jelastic, Inc | 1293290 | 9 | 69.97 | 193 | 1022 | 2260 |
| Nestify | 851045 | 0 | 47.54 | 1010 | 730.67 | 1560 |
| Pantheon | 1289653 | 1 | 74.76 | 59 | 1180 | 2480 |
| Pressable | 1337047 | 0 | 75.3 | 63 | 1590 | 3460 |
| Seravo | 881714 | 148 | 48.89 | 731 | 789.96 | 1750 |
| Servebolt.com | 1104070 | 5 | 61.12 | 236 | 913.11 | 1970 |
| WPOven | 895233 | 0 | 49.85 | 700 | 814.52 | 1740 |
Full interactive results can be referenced here.
Discussion
Jelastic, Pantheon, Pressable, Seravo, Servebolt and WPOven didn’t experience any issues with the Load Impact test.
Check out WPOven’s performance load time performance here.
Conclusion
According to review signal, the following there the final winners of all the tests that were performed
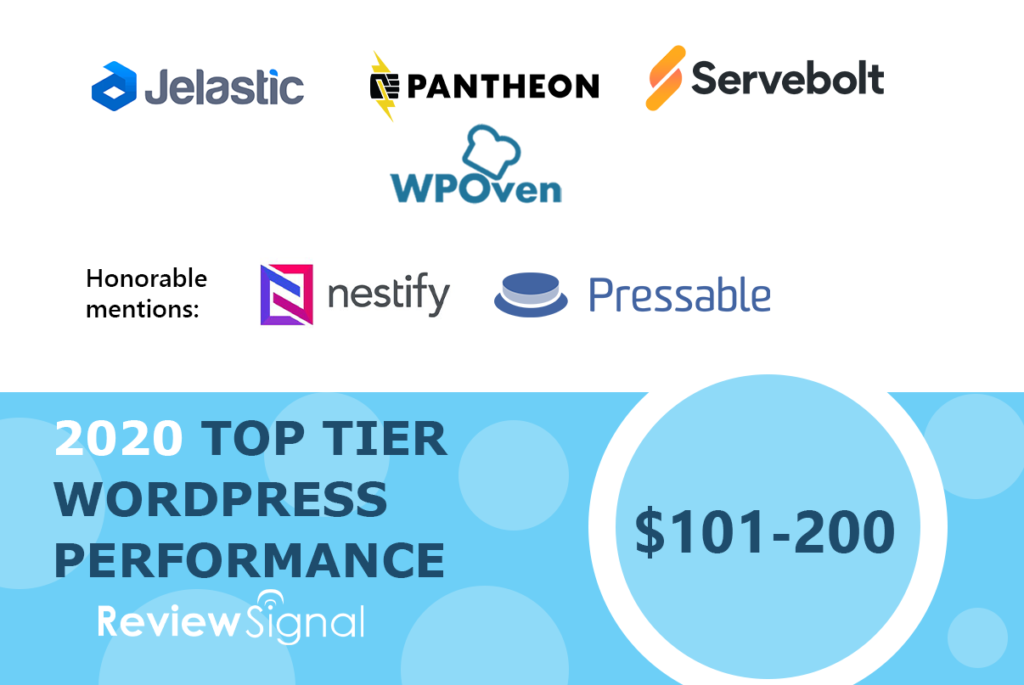
Top Tier
Jelastic, Pantheon [Reviews], Servebolt, and WPOven all earned Top Tier status this year. They didn’t struggle at any point during this testing.
Uptime Monitoring Results
Uptime is monitored by two companies: Uptime Robot and StatusCake. A self-hosted monitor was also run in case there was a major discrepancy between the two third party monitors.
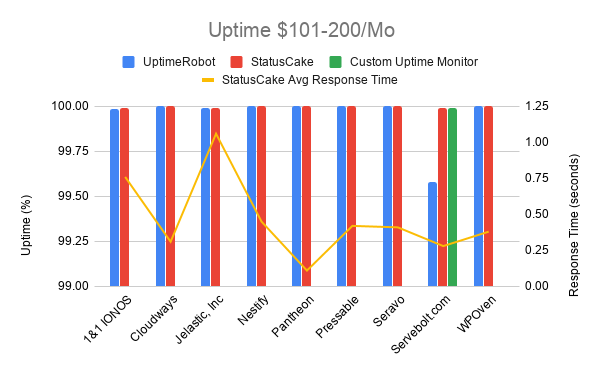
Results Table
| Company Name | UptimeRobot | StatusCake | StatusCake Avg Response Time | Custom Uptime Monitor |
| 1&1 IONOS | 99.986 | 99.99 | 0.76 | |
| Cloudways | 100 | 100 | 0.31 | |
| Jelastic, Inc | 99.99 | 99.99 | 1.06 | |
| Nestify | 100 | 100 | 0.45 | |
| Pantheon | 100 | 100 | 0.11 | |
| Pressable | 100 | 100 | 0.42 | |
| Seravo | 100 | 100 | 0.41 | |
| Servebolt.com | 99.582 | 99.99 | 0.28 | 99.99 |
| WPOven | 100 | 100 | 0.38 |
Discussion
Every company did well maintaining above 99.98% uptime.
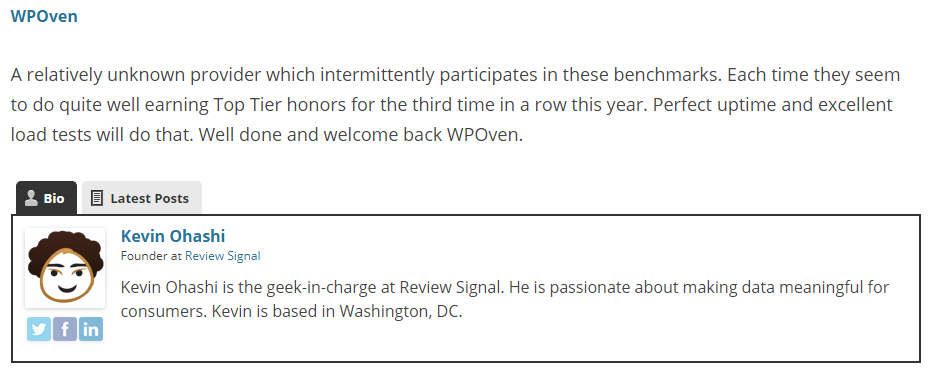
The WPOven got the following review from Kevin –
WPOven – The Dedicated WordPress Hosting provides you with –
- FREE SSD Storage
- FREE SSL CERTIFICATE
- FREE Business Email
- FREE Over 100 premium themes and plugins
- FREE Daily Off-Site Backups
- FREE Malware Screening & Cleanup
- FREE WordPress Dev & Server Support
- Dedicated Server
Our plans start at $16.61. With dedicated VPS, dedicated resources, server stack, etc

Snehil Prakash is a WordPress enthusiast and web development expert who previously served as the Marketing Manager at WPOven. He believes that business owners should spend their time investing in their core business missions, not setting up and maintaining a WordPress site.
Snehil has been instrumental in providing all-inclusive managed WordPress solutions to businesses of all sizes, ensuring that they have the resources they need for a robust online presence.

