There is nothing in the world that is termed Ideal or absolutely perfect. Everything that exists whether it is a smartphone or your work efficiency and even humans cannot be perfect. Similarly, there is no CMS available till now that is 100% perfect and has no issues or Errors present in them regardless of how big its market share is and its popularity.
We can only reduce or eliminate the bugs from time to time. Similarly in WordPress, to remove errors or bugs you need to enable WordPress Debug mode in WordPress to get bugs to report if there are any. In addition to it, there are also third-party tools available that can help you with WordPress debugging.
In this post, we will try to get into depth about What WordPress Debug is? How you can enable it on your WordPress and the alternate ways in which you can start WordPress Debug.
What do you mean by WordPress Debug or Debugging?
The word Debug or Debugging means to detect or identify the possible errors or bugs (in terms of IT) in your program or codes. During the Debugging process, after identifying the bugs the final step is to make sure the bug has been removed, the issue has been resolved, and make ensure that it won’t happen in the future again.
This debugging process is mainly carried out or performed by coders or developers by using various tools available online, and it is one of the crucial stages of any software development process.
This process is usually done in various sub-stages with proper strategies hence, before publishing any software or code, it has to go through multiple testing stages where developers or coders try to identify any errors or issues. If found any, developers isolate them and try to fix them as soon as possible.
The process can be excruciating and hectic, hence it might take longer than coding the software itself.
What is the function of WordPress Debug?
As you may have known, the core WordPress software is developed on PHP, and so are WordPress plugins and themes. So, if there any error occurs, enabling WordPress Debug mode can let you know what is going wrong with WordPress by simply showing an error message, notices, or Warnings in the form of PHP.
Whenever you enable WordPress to debug mode on your WordPress, you will start seeing error messages on your WordPress Dashboard, whenever there is an issue occurs.
After that, you can either fix the problem on your own or ask your developer to solve the occurred.
How to get all WordPress Debug notifications or WordPress Debug logs?
After enabling WordPress Debug mode, you will start receiving warnings, error messages, or notifications regarding errors on your WordPress, but all these messages will not be saved on your WordPress.
However, you can save all your error messages and create error logs. All you need to do is to enable another option i.e. WordPress Debug log. Enabling this feature will save all of the error messages, notifications, or warnings to a file on your server.
Whenever you enable WordPress to debug log mode, by making the WP_DEBUG_LOG constant true. WordPress will start saving all the error messages to the WP-content/debig.log file. However, you can also customize or change the path of this file to the desired location on your server.
In addition to it, you can also change the appearance of error messages if you like them whether displayed or not. And your WordPress debug mode will be still enabled.
How to enable debug mode in WordPress?
Some Webhosting companies provide you with a dedicated link to enable WordPress to debug mode, however, if you do not have that option, you can use either of the two ways:
- Enable WordPress Debug mode using the WordPress debug plugin.
- Manually Enable WordPress Debug Mode
1. Enable WordPress Debug Mode using WordPress Debug Plugin
If your Web hosting service provider doesn’t provide you with a dedicated link to enable WordPress to debug mode, you can always use WordPress plugins that help you to enable debug mode. However, when it comes to WordPress plugins there are thousands of plugins available and it becomes difficult for users to choose the best one.
Hence, for your convenience, we recommend you use the WP Debugging tool available free to download and use in WordPress Directory.
WP Debugging

WP Debugging is an Open source software developed by Andy Fragen. When you successfully install and activate the plugin, at that moment it starts working.
The plugin will set the following debug constants in wp-config.php by default, and the default constants will be automatically removed after removing or uninstalling the plugin.
The default settings are:
define( 'WP_DEBUG_LOG', true ); //saves all the notifications and warnings in a log filedefine( 'SCRIPT_DEBUG', true );define( 'SAVEQUERIES', true );
You can also configure the above options in the WordPress dashboard as well. Go to your WordPress Dashboard > Tools > WP Debugging.
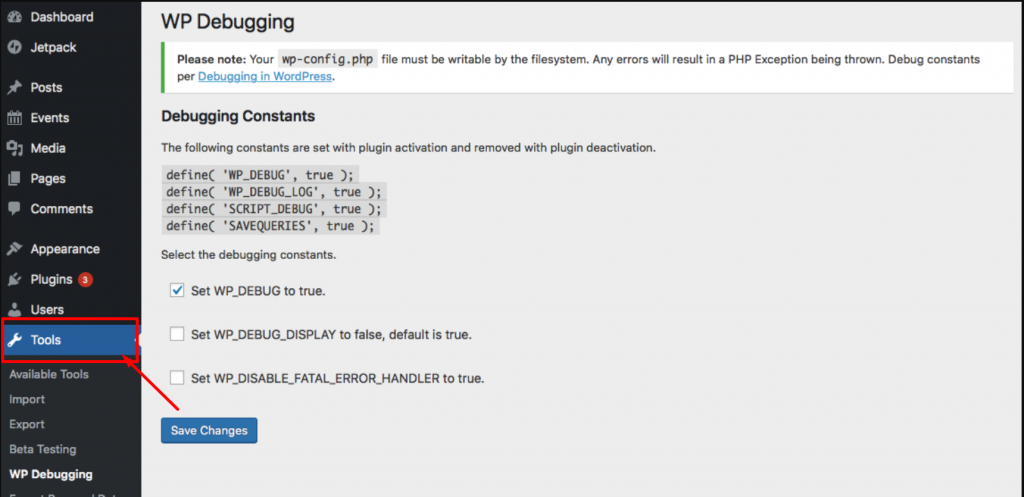
After configuring all the WP Debugging settings, one thing to keep in mind that to deactivate the plugin, so that it can disable the debug mode.
2. Manually Enable WordPress Debug Mode
If you do not like to use WordPress Debug Plugin for any reason, you have a manual option to do that. To enable WordPress to debug mode manually you need to add some constants to your Wp-config.php file.
And to configure your wp-config.php file, you need to connect to your server using the File Transfer Protocol (FTP) client. Most probably you will find the wp-config.php file in your root folder or your website and when you can locate the file, open it and make some edits.
The wp-config.php file mostly contains all your website’s configuration settings, such as settings by web hosting provider, database information, and other vital information. Now to enable the WP debugging, you need to look out for this line of code:
('WP_DEBUG',false);
Now, when you can find the above code line, the next thing you need to do is copy the below code over the
// Enable WP_DEBUG modedefine( 'WP_DEBUG', true );
// Enable Debug logging to the /wp-content/debug.log filedefine( 'WP_DEBUG_LOG', true );
// Disable display of errors and warningsdefine( 'WP_DEBUG_DISPLAY', false ); @ini_set( 'display_errors', 0 );
// Use dev versions of core JS and CSS files (only needed if you are modifying these core files)define( 'SCRIPT_DEBUG', true );
/* Now you are done, save and Exit
Note: It is not highly recommended to change the WP_DEBUG_DISPLAY to true or else the errors will start displaying on your live website.
After pasting the above code in your wp-config.php file, you need to save the changes and exit the text editor. Now you have successfully activated the Debugging mode.
However, if you like to enable just the basic WordPress debugging mode, you can add the code below:
define( 'WP_DEBUG', true ); // To enable WP_DEBUG mode on
Now once you can debug your website, you can disable the debug mode by either setting the constants to false or by simply removing the snippet from the wp-config.php file.
What if WordPress debug log file is not created?
Sometimes the WordPress debug log location can be different from the default location. It is due to some of the Web hosting providers collecting all the errors and warnings generated by WordPress and store in a custom log file.
So, if WordPress debug log file(debug.log) is not created, you must check out other files or folders with similar names in the root directory. If you are still unable to find any, contact your web hosting provider and ask them about the WordPress debug log location.
Why it is necessary to disable WP Debug mode once you are done?
No doubt, the WordPress debug mode is very handy if you are trying to fix errors or any other issues with WordPress, But one thing you should note is that the debug mode should not be on after troubleshooting the errors. It is because it will keep showing error texts or messages from your PHP code to your website visitors.
Since we have already mentioned this point in the above sections quite a few times just to remind you to always disable your WordPress debug mode when you are done troubleshooting.
Some tips to debug problems in WordPress
Apart from just activating WP_DEBUG mode to identify the errors on your WordPress, there are also some useful tips and tricks you can follow that help you to debug problems in Word Press.
For example, when your WordPress site suddenly crashes or shows a white Screen of death. The most common debug method for this problem is to deactivate your plugins and themes and check their updates. This method will help you to sort out the exact reason behind this reason but this method can be quite time-consuming. And there are also high chances that you might not be able to notice the real problem.
Hence, it becomes necessary that you must use the right tool to identify the root cause of the error and fix it as soon as possible.
1. Enable WordPress Database (WPDP) Error Reporting
You can also detect and identify any problems regarding the WordPress database by enabling WPDP in your WordPress. The object $wpdb has a variable that lets you see all the database errors and it is called $show_errors. If you set this variable to true, all the SQL errors will start displaying for any query.
var $show_errors = true; /** to show SQL/DB errors /var $suppress_errors = false; /* to suppress errors during the DB bootstrapping. */
Now to enable WPDP error reporting, you need to go to your public_html file and look for the wp-dp.php file inside the folder wp-includes. Open the database file and search wpdb class to change the $show_errors variable to true.
2. Lookout your Website’s Complete Error logs
On some occasions, you might face an internal server error page while browsing the website. The best thing you can do to fix this error is by checking out your website’s complete error logs.
Just reviewing your website’s complete error logs can be very helpful for anyone to identify the possible culprit. After identifying the possible culprit, if you do not know how to fix it simply a Google search would help you out to provide you with all the possible solutions available.
3. Always Use a WordPress staging platform while playing with codes
It is always said, prevention is better than cure, hence, if you want to reduce the risks or minimize the errors on your WordPress website. The best thing you can do is to make any tweaks or changes first on a Staging platform.
A staging platform or website is an exact copy of your live website and it is hosted on your website’s subdomain. This clone website will work as a testing and development ground where you can add codes and run tests before making it live.
In addition to it, this staging site won’t be visible to any of your website visitors or even search engines won’t be able to find it. Hence, it provides you with a complete environment to do experiments without any limitations and without affecting your live website.
4. You can also Enable SCRIPT_DEBUG mode
To improve your website performance and increase the loading time, WordPress uses CSS and javascript files. But sometimes these Java scripts can have some hidden error codes that can create problems for your website.
So to eliminate such problems with script execution, WordPress provides you with a constant that can be added to your wp-config.php file.
All you need to add the snippet ( ‘SCRIPT_DEBUG’, true );
define(SCRIPT_DEBUG', true);
When the script debugs mode is turned true, WordPress will turn all plugins to use their full version and use the development version of CSS and javascript files rather than the compressed versions.
6. Detect or Identify PHP errors
PHP info is one of the very useful files that can help you to detect PHP errors early. The file includes all the information regarding the present state of PHP such as the version, Operating system version, compilation options, License, and many more.
To enable this error reporting method, you need to configure the php.ini file. It is because you do not have been provided with an option to have root access to enable this error reporting feature.
However, you can always use an alternate solution i.e. online PHP code checker tool that helps you to provide complete guidance to identify the errors.
WordPress Debugging Plugins
1. Query Monitor

The Query Monitor plugin is one of the best tools available that provide a complete developer tool panel for WordPress. This plugin will let you enable debugging of database queries, HTTP API calls, PHP errors, stylesheets, and many more.
However, there are plenty of other options are also available but they might show compatibility issues with the latest version of WordPress. This plugin is available free to use and download from the WordPress directory and capable of doing the majority of the work.
Some of the key functions that this plugin is capable of:
- All Database queries.
- PHP errors.
- Template filename.
- Hooks and actions.
- Block editor blocks.
- Enqueued scripts and stylesheets.
- HTTP API requests
- User capabilities check and many more.
2. New Relic
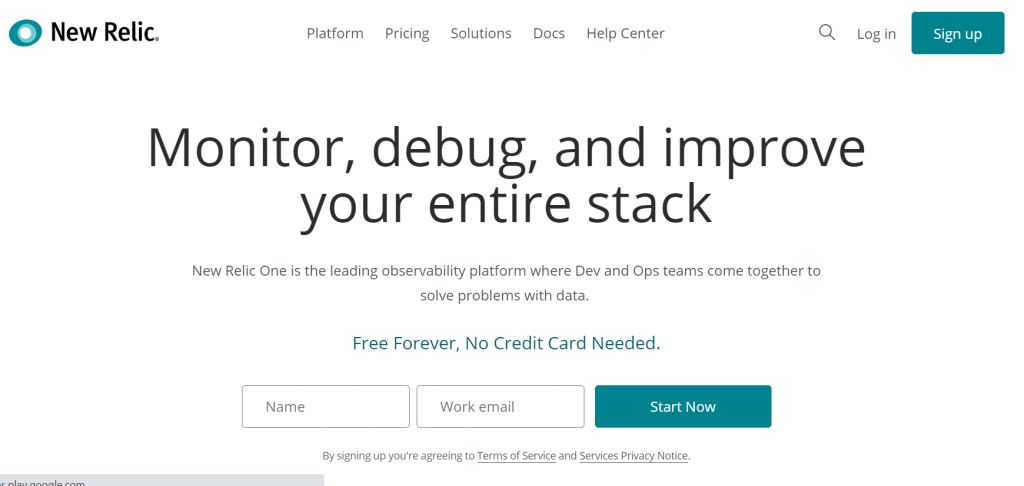
If you are looking for a more robust and efficient solution, then you are required to go for some premium options such as the New Relic tool. This tool of the app will let you monitor user experience, discover bottlenecks, and analyze issues that are affecting your website performance.
All these features will provide you a complete data about your website issues to work on and help to deliver the best possible user experience.
You can also experience this tool for 14 days free trial period and then you can decide whether to buy or not.
Some key features you will get in New Relic:
- Log management
- Error Tracking
- Browser Monitoring
- Application Monitoring
- Mobile Monitoring and many more.
Summary
If you are looking to eliminate all the bugs or errors on your WordPress site, the best thing you can do is to enable its built-in feature called WordPress to debug mode. It is one of the very useful ways through which you can easily view all the PHP errors and warnings that your WordPress is facing.
If your web hosting service provider has provided you with a dedicated option to enable WordPress debug mode or else you have always used alternate paths such as using a WordPress debug plugin or adding code snippets directly to your wp-config.php file.
If you like to get more help or get much deeper into it, you can also use other premium or third-party tools that make it much easier for you.
If you have any questions regarding WordPress debugging or anything you like to add more, that we were unable to mention in this post. Please do let us know in the comment section below.
Frequently Asked Questions
How do I debug WordPress?
There are plenty of ways to debug your WordPress site are:
1. Enable WordPress Debug mode.
2. Enable WordPress Database Error Reporting (WPDP)
3. Active your Error logs and check out them.
4. Enable Script_debug
5. Use PHP code checker
6. You can also use some tools such as New Relic or Query Monitor
What does debugging in WordPress mean?
The word Debug or Debugging simply means to detect or identify the possible errors or bugs (in terms of IT) in your program or codes. In Debugging, after identifying the bugs, the final step is to make sure the bug has been removed, the issue has been resolved, and ensure that it won’t happen in the future again.
Where do I find WP debug?
Once you have successfully enabled WordPress_debug as well as WordPress_debug_log or set it to true. The error logs will start saving your debug.log file in your Content directory(wp-content/debug.log). However, you can also change the file path.

Rahul Kumar is a web enthusiast, and content strategist specializing in WordPress & web hosting. With years of experience and a commitment to staying up-to-date with industry trends, he creates effective online strategies that drive traffic, boosts engagement, and increase conversions. Rahul’s attention to detail and ability to craft compelling content makes him a valuable asset to any brand looking to improve its online presence.

